The Logb viewer
`logbview` opens a `.logb` file in your browser. Pick signals from a tree, plot them, drag to zoom. It is to Logb roughly what asammdf's viewer is to MDF — a way to look at a recording without writing a script first.
go run github.com/rveen/logb/viewer/cmd/logbview@latest recording.logb
It indexes the file, starts an HTTP server bound to loopback, and opens your browser at it. Nothing is uploaded anywhere; the file never leaves the machine.
The viewer is not part of the specification. It is a second implementation of the reading side, and it is on this site because of what it demonstrates: the scale and random-access behaviour below are not clever engineering bolted on top of the format, they are consequences of the format's design rules. Where the viewer and the specification disagree, the specification wins.
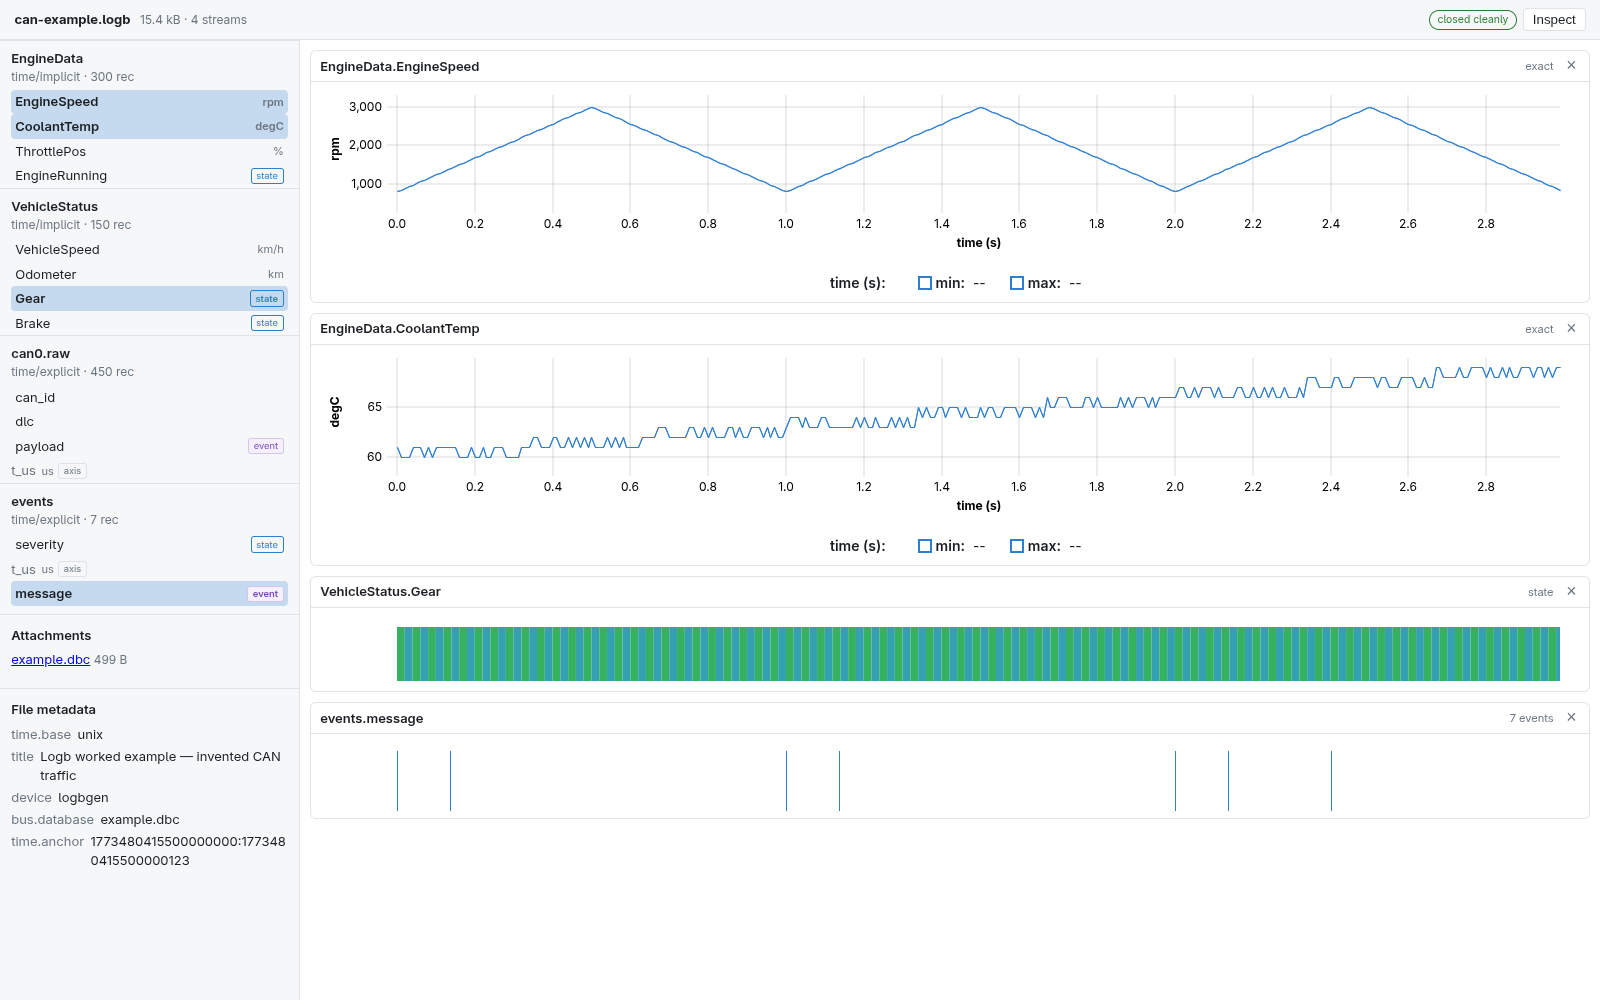
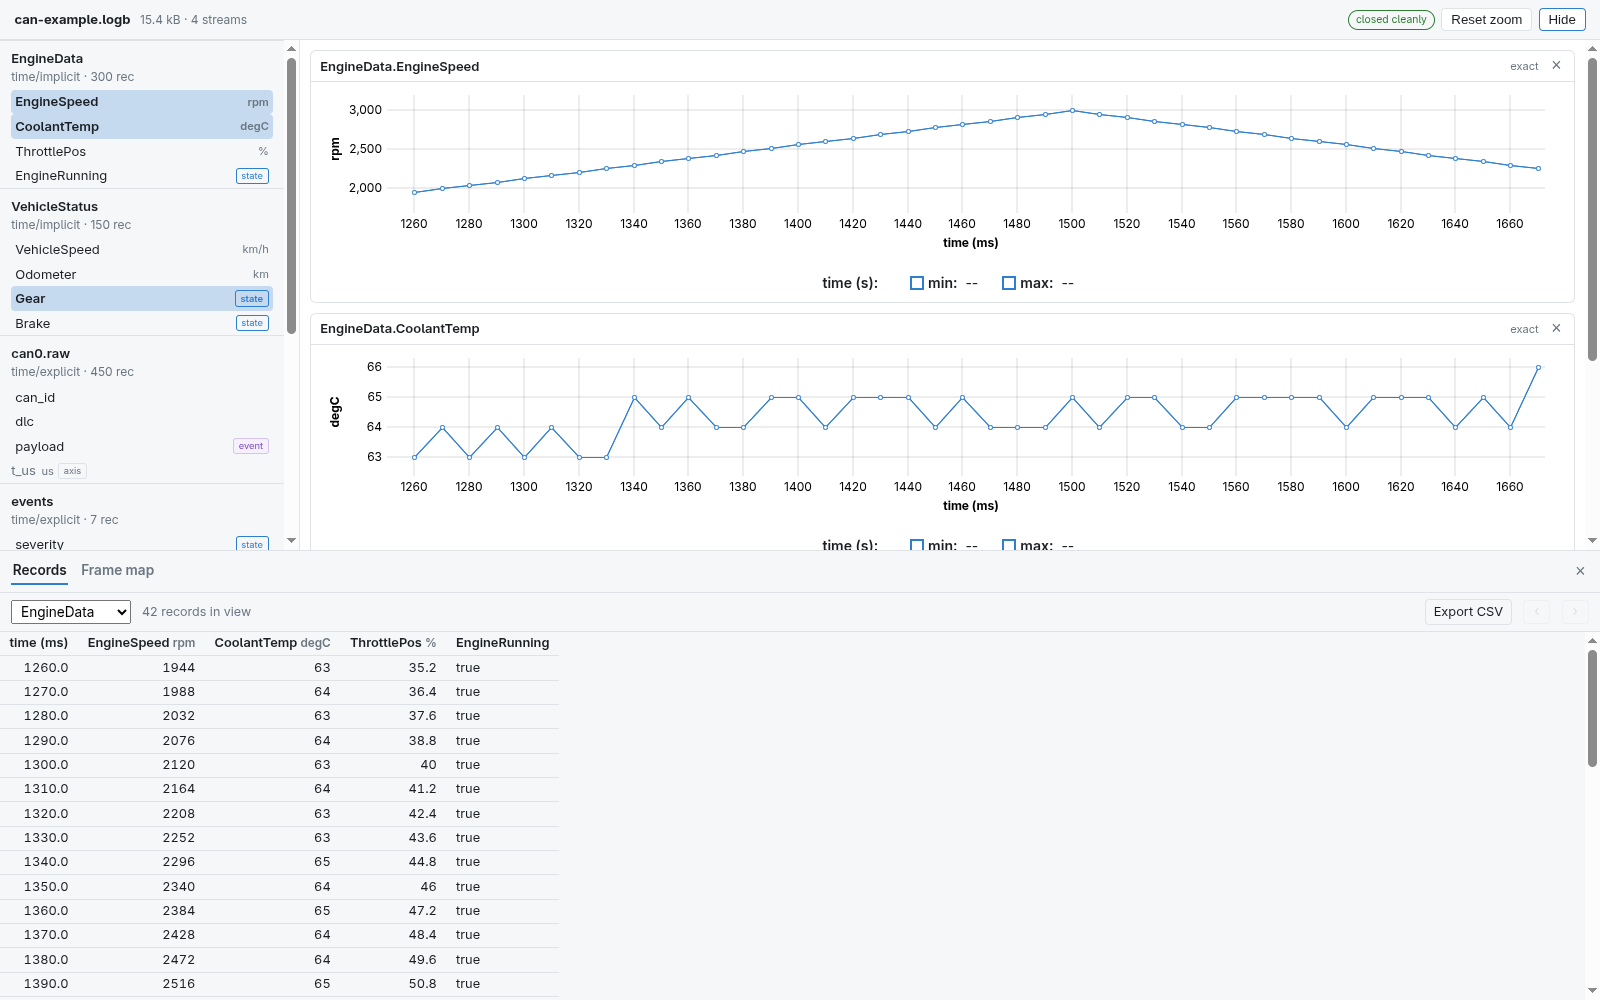
A worked CAN example — 15 kB, four streams. `EngineSpeed` and `CoolantTemp` are numeric panes, `Gear` is a state band rather than a line, and `events.message` is an event lane. The badges in the tree say which is which before you click.
Drag to zoom; every pane shares one axis
Selecting a region on any pane rescales all of them. The cursor readout is synchronised across panes, so the value of every plotted signal at one instant is readable in one glance — and the axis relabels itself from seconds to milliseconds as the window narrows.
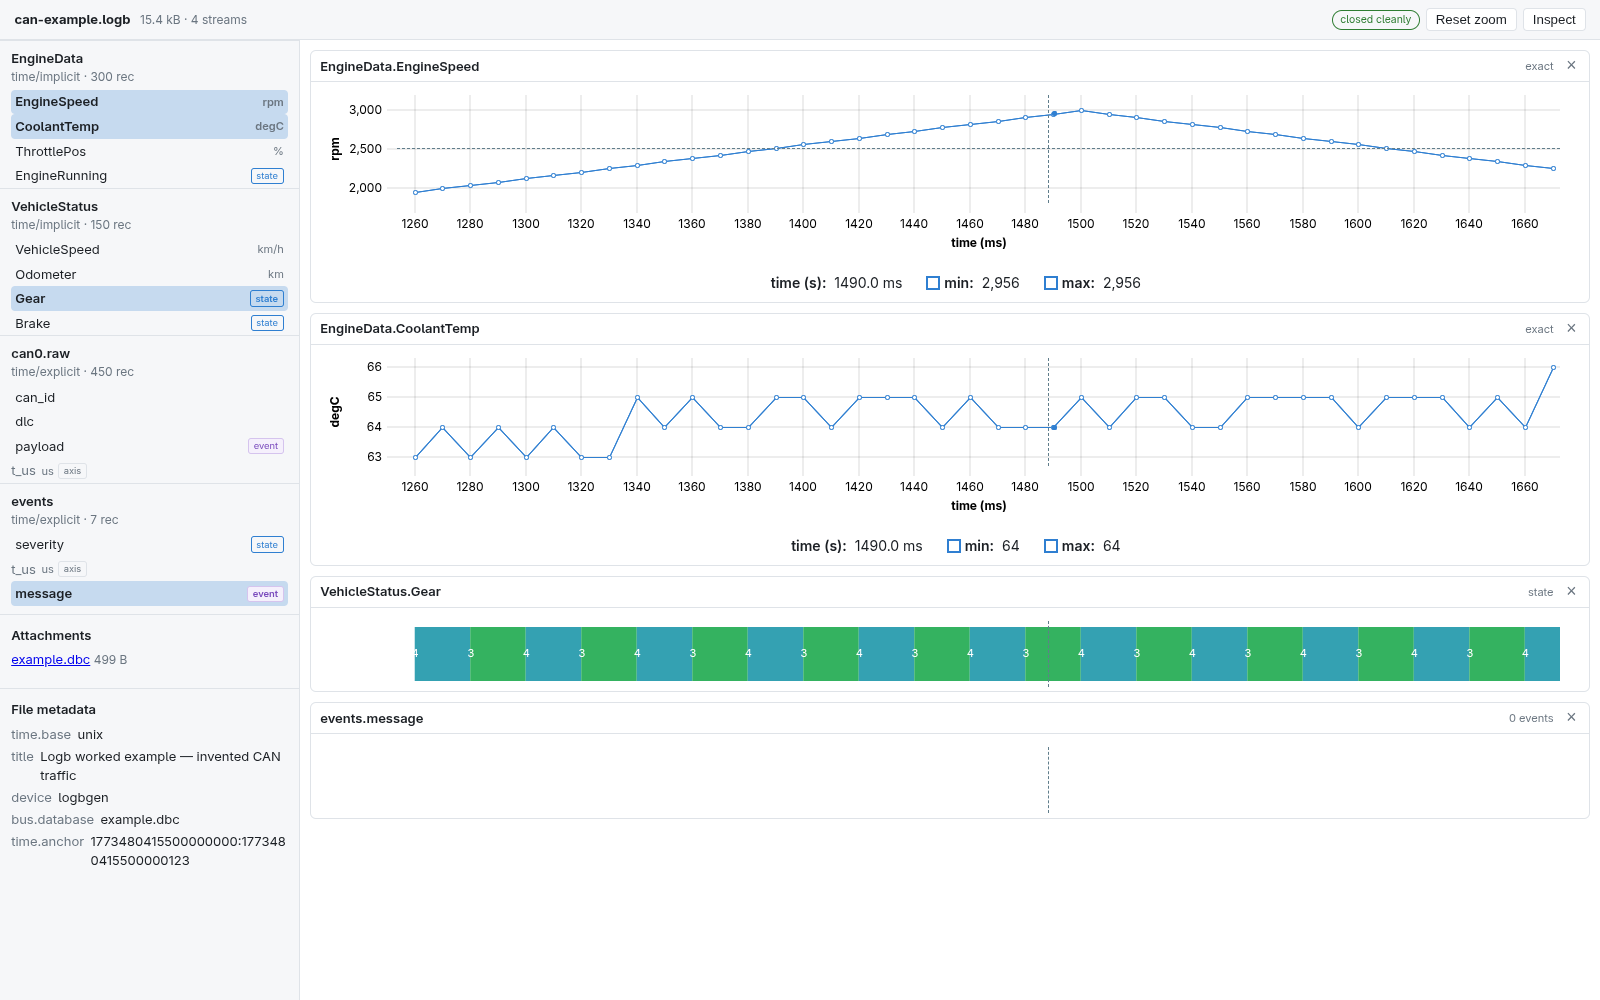
Note the `exact` badge at the top right of each pane. Zoomed out, that pane said `min/max`: the chart tells you whether you are looking at decimated statistics or at decoded samples, rather than leaving you to guess.
An absent sample is not a zero
A guarded field is genuinely absent from records where its guard does not hold — a multiplexed CAN signal, a value that only exists in one mode. The viewer draws that as a gap. It does not interpolate across it and it does not draw zero, because both would be inventing data the recording does not contain.
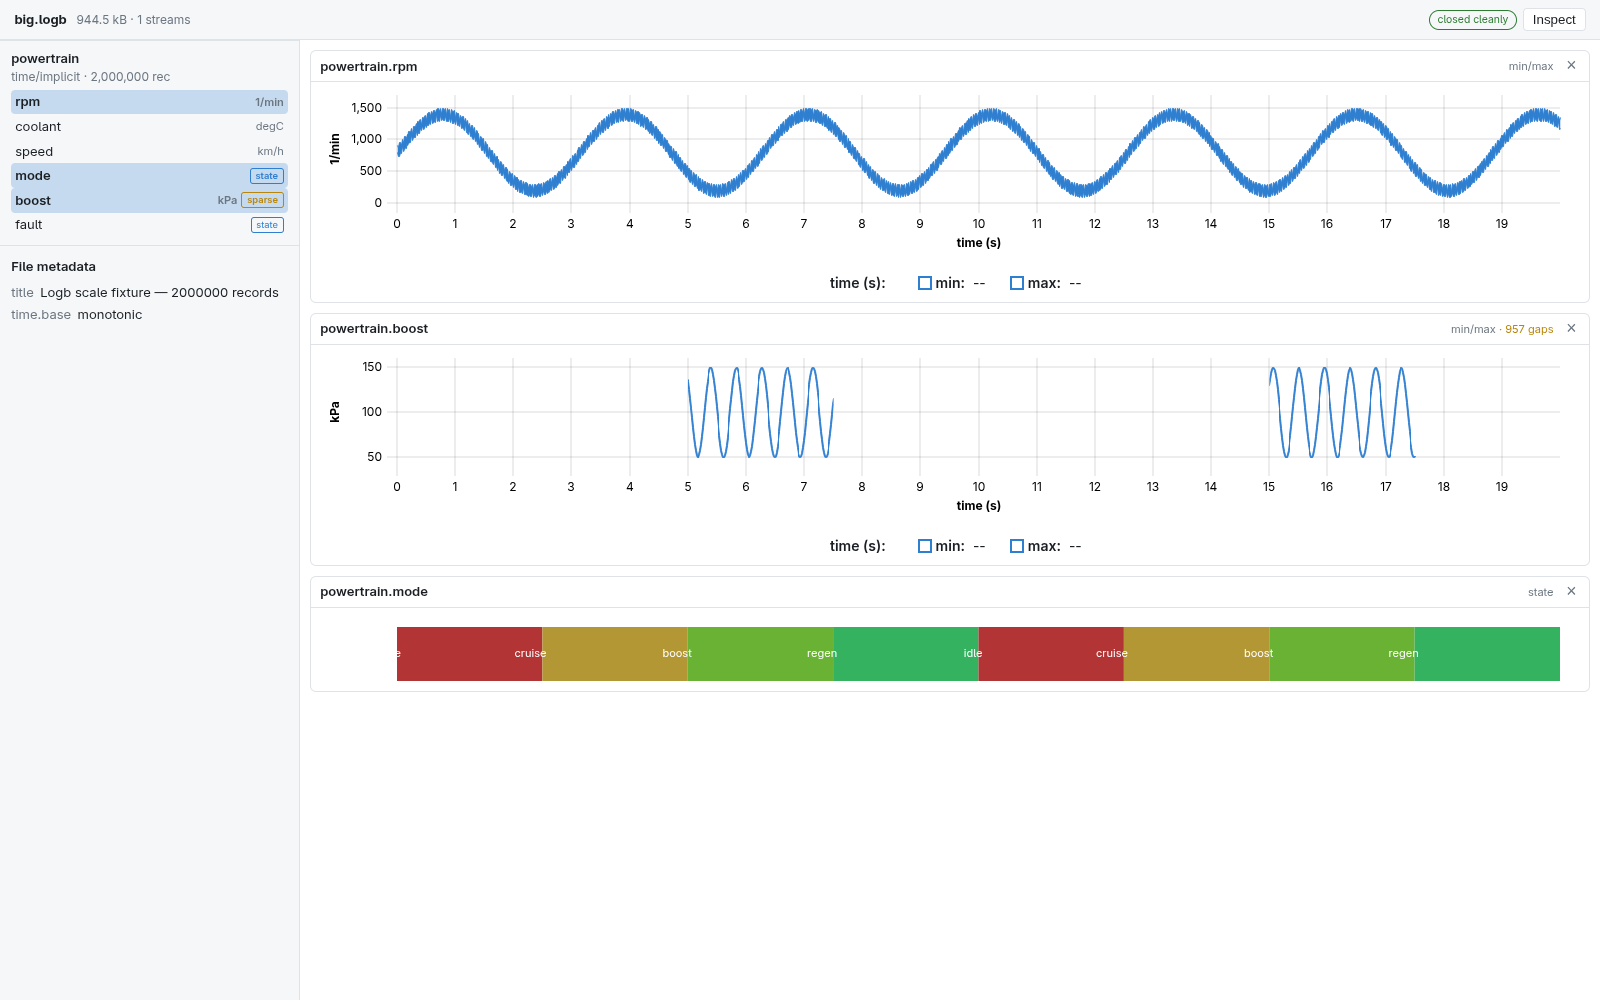
Two million records. `boost` carries the `sparse` badge and exists only while `mode` is `boost` — the gaps in the top trace line up exactly with the bands in the bottom one. The pane header reports 957 gaps rather than hiding them.
Two related refusals, for the same reason:
- An enumeration is not a number. Categorical fields are drawn as labelled
state bands. Asking for them as a numeric series is refused, not silently averaged. Where a decimation bucket held more than one value, the band is drawn hatched rather than picking a winner.
- Time is an integer. The axis is int64 ticks, as
§5 defines it. Unix nanoseconds exceed what a float64 holds exactly, so values are rebased to a per-file epoch instead of being quietly rounded.
Not a time-series viewer
The domain axis is general, so the viewer is too. An AC sweep is a stream on a logarithmic frequency axis, and a stepped parameter produces runs — which overlay on one pane, coloured and labelled by the parameter that was stepped.
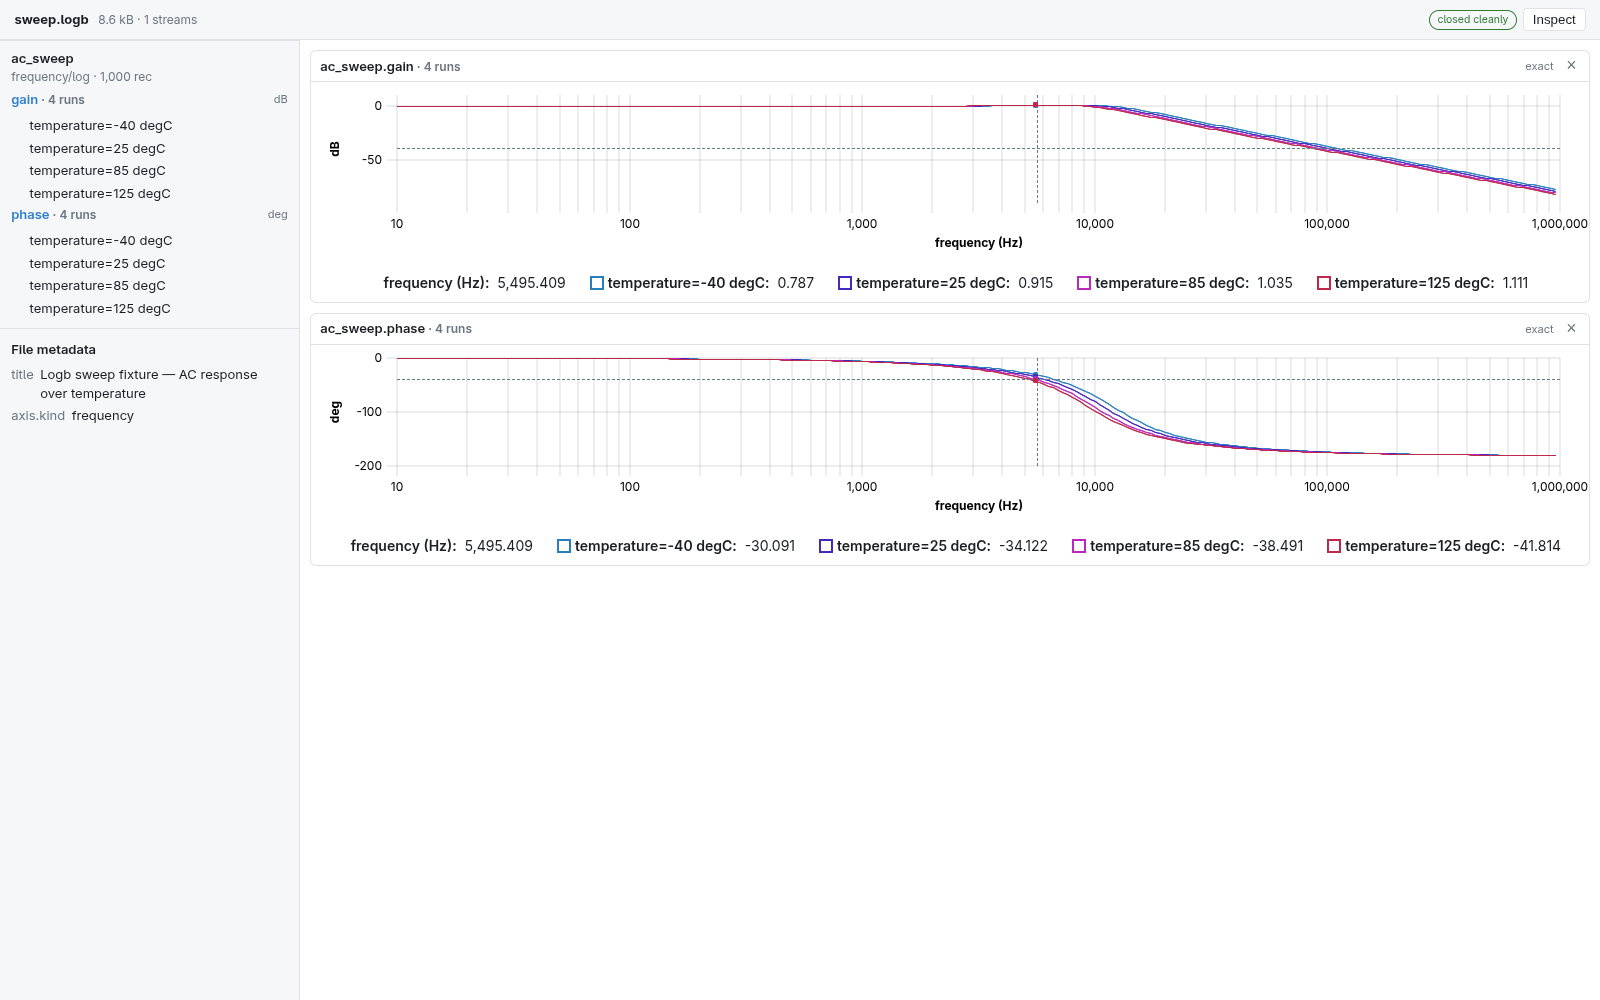
Gain and phase against frequency, four runs at −40, 25, 85 and 125 °C. The cursor readout gives all four values at 5,495 Hz. No part of this is a time series, and nothing in the viewer is special-cased for it.
The record table
The same window the charts show, as rows. It mirrors the formatting of `logbdump`, pages without decoding frames it does not need, prints the time column in the stream's own unit, and renders an absent field as a dash rather than a blank that might be confused with a value.
Export CSV writes exactly the window in view. If a field cannot be honestly represented it refuses rather than truncating.
The frame map
A visual `logbdump`: the file's byte layout drawn to scale, with a frame table underneath. This is the pane that makes the file structure of §3 visible.
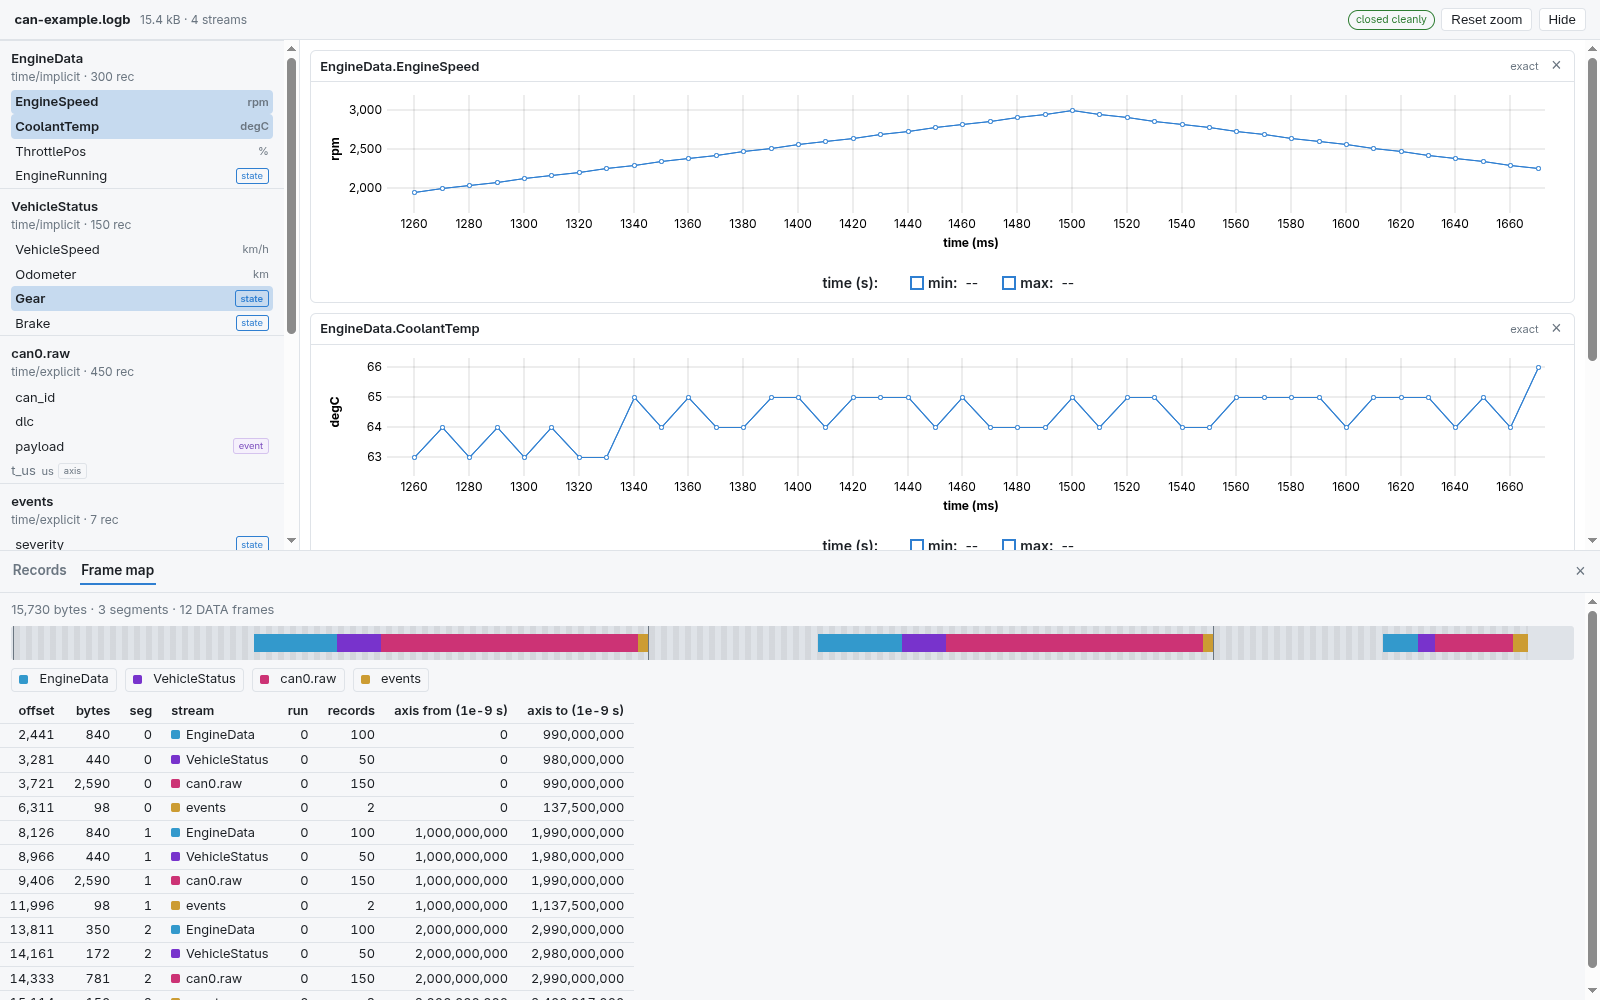
Three segments, twelve DATA frames, 15,730 bytes. Each segment restates its schemas — that is the repetition rule 3 requires. The third segment is visibly shorter than the first two because it was written transposed and deflated; same records, fewer bytes.
Why it is fast, and why that is the format's doing
Measured on a 100 million record fixture — 600 million samples across six fields:
| First open | 24 s, with a progress bar |
| Subsequent opens | 7 ms, from the sidecar index |
| Resident memory | 22 MB indexing, 10 MB serving |
| Whole-file overview | 2 ms |
| Zoom to one second (100k samples) | 17 ms |
Memory is bounded by frames × fields, not by samples, so it barely moves as the file gets longer.
Three properties of the format do most of the work:
Random access without a seek API, and without trusting the index. The core reader is single-pass, and §9 forbids trusting a file's own INDEX frame over the frames themselves. Design rule 3 says a file can be cut anywhere and still decode, because every segment restates its schemas. The corollary is that a segment's preamble placed in front of any of that segment's DATA frames is a byte stream the unmodified reader decodes correctly:
io.MultiReader(
    prefix,                                   // file header ‖ SYNC ‖ SCHEMA ‖ RUN…
    io.NewSectionReader(f, frame.Offset, n),  // any DATA frame, in any order
)
So frames decode on demand, in any order — including on a truncated file and across a concatenation join — with no seek support in the reader at all.
Two tiers, with a safety property. A first pass records per-frame statistics, about 40 bytes per field per frame. Whole-file overviews are drawn from those without decoding anything. Once you zoom past a threshold, the exact records are decoded. The invariant is that a Tier 1 envelope always contains the Tier 2 one, so zooming in narrows what you see and never contradicts it.
A sidecar index that survives the file growing. The index is cached beside the file as `<file>.logbview`. Because the format is append-only and nothing points forward, a file that grew since the last open needs only its tail rescanned — what was indexed before is still true. The cache is versioned and discarded on mismatch.
And because the server comes up before indexing finishes, with progress streamed over SSE, a large file is browsable while it is still being read.
Running it
The viewer is a separate Go module, so that the frontend bundle it embeds does not land in the file set of everyone who `go get`s the core library.
git clone https://github.com/rveen/logb
cd logb/viewer
go run ./cmd/logbview ../testdata/can-example.logb
| Flag | Default | Meaning |
|---|---|---|
| `-addr` | `127.0.0.1:0` | listen address; port 0 picks a free one |
| `-open` | `true` | open the default browser |
| `-cache` | `128` | decoded-frame cache budget, MiB |
| `-nocache` | `false` | ignore and do not write the sidecar index |
The fixtures used for the screenshots on this page are generated by `logbgen`:
go run ./cmd/logbgen                      # testdata/can-example.logb
go run ./cmd/logbgen -big 2000000 -o big.logb    # the sparse-field example
go run ./cmd/logbgen -sweep 4 -o sweep.logb      # the log-axis example
The frontend is TypeScript, Preact and uPlot; the server is Go standard library only. Everything is MIT except the vendored libraries, which are MIT, Apache-2.0 and BSD-3 — no copyleft. Source and full notes are in `viewer/`.